


The premise described in the article has already changed. According to Bloomberg data on OIS market pricing, expectations for Federal Reserve rate increases in 2026 peaked at nearly 44 basis points in late July — almost two hikes — and by August 14 had fallen to 22.7 basis points. In other words, the market is no longer pricing in even one full hike.
The target range remains at 3.50%–3.75%, with the effective federal funds rate at 3.63%. The meeting-by-meeting distribution shows that the market expects no move in 2026: 9 basis points for September, 14 for October and 23 for December. The first full hike — more than 25 basis points — is priced for January 2027, and the curve reaches 36 basis points by June 2027.
This move does not invalidate the article’s argument; it confirms it. Within six months, markets moved from pricing in two rate cuts to pricing in two rate hikes , and then back to half a hike. The point was never where interest rates would ultimately end up, but how quickly the market changes its mind.
For months the markets expected that Kevin Warsh, Donald Trump's choice for the chair of the Federal Reserve, would move in favour of lower interest rates. Reality upended this expectation. Persistent price pressures and the central bank's tighter stance have led the bond market to shift from pricing in cuts to factoring in up to two interest rate hikes. Amidst this dramatic turnaround, the recent acceleration of a lesser-known measure of the money supply—Divisia—acquires special significance: can it explain why yields remain high or has the market already gone too far?;
Speaking to Bloomberg, Ken Shinoda argued that investors should not base their strategy on the assumption of a rapid fall in interest rates. The Federal Reserve — the US central bank, known as the Fed — directly controls the key short-term interest rate, but not the entire market. Large budget deficits, increased government bond issuance and persistent inflationary pressures can keep long-term yields high, even when political leaders wish for lower borrowing costs.
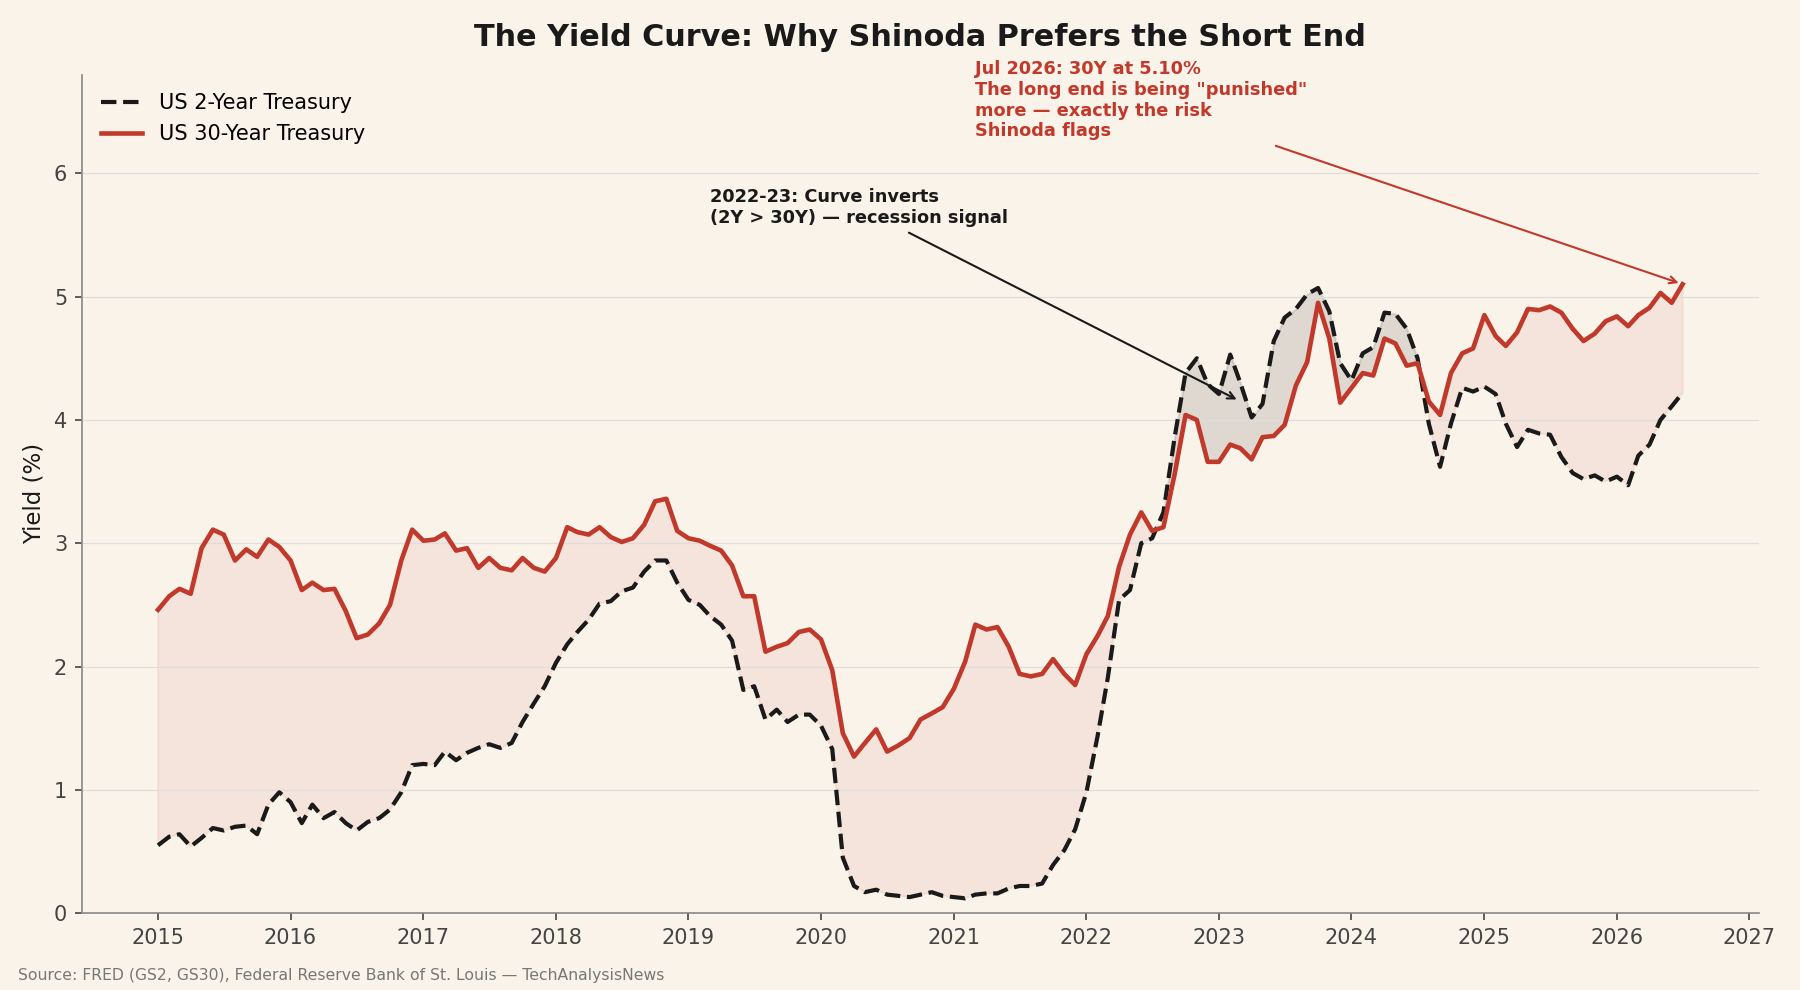
The yield curve — the comparison of interest rates offered by bonds of different maturities — inverted in 2022–23, when the 2-year bond yielded more than the 30-year bond, a pattern that often precedes an economic slowdown. Since then, it has returned to a positive slope and the yield on the 30-year bond, that is, the annual income the market demands to hold it, reached 5.10% in July 2026. Shinoda therefore favors short-term carry: the collection of relatively high current income from short-term securities, without the high sensitivity of long-term bonds to interest rate changes.
The debate over the money supply returned after the pandemic, when the abrupt monetary expansion preceded the strongest inflationary surge in recent decades. The usual M2 adds cash, current accounts, savings, and certain money market mutual funds as if they all offer the same monetary service. The question is whether this simple aggregation conceals information about future demand and price pressures.
Divisia attempts to bridge this gap. Instead of giving equal weight to each category of money, it weights it according to its opportunity cost — the difference between its yield and the yield of a benchmark asset. Simply put, it tries to separate liquidity that is most easily used for payments from cash holdings that act more as savings.
In July 2026, the economists Stephen Miran (Stephen I. Miran), Nouriel Roubini and Peter N. Ireland published the study A Return to Monetarism?. The authors do not suggest a return to mechanical money supply targeting. They argue, however, that monetary aggregates still contain useful information for future growth and inflation and that the Federal Reserve has sidelined them excessively.
The link to this analysis is direct: the study examines plain M2 alongside the weighted Divisia M2 and Divisia M4 measures, and points out that the Divisia measures often outperform plain aggregate measures, because they assign different weights to assets depending on how much «money» they actually are. By applying the P-star model to updated data, the authors treat the money supply as a useful warning signal — not as automatic evidence of future inflation. In this light, the acceleration of Divisia M4 to 6.9% warrants attention, but must be interpreted in conjunction with velocity, demand and supply conditions.
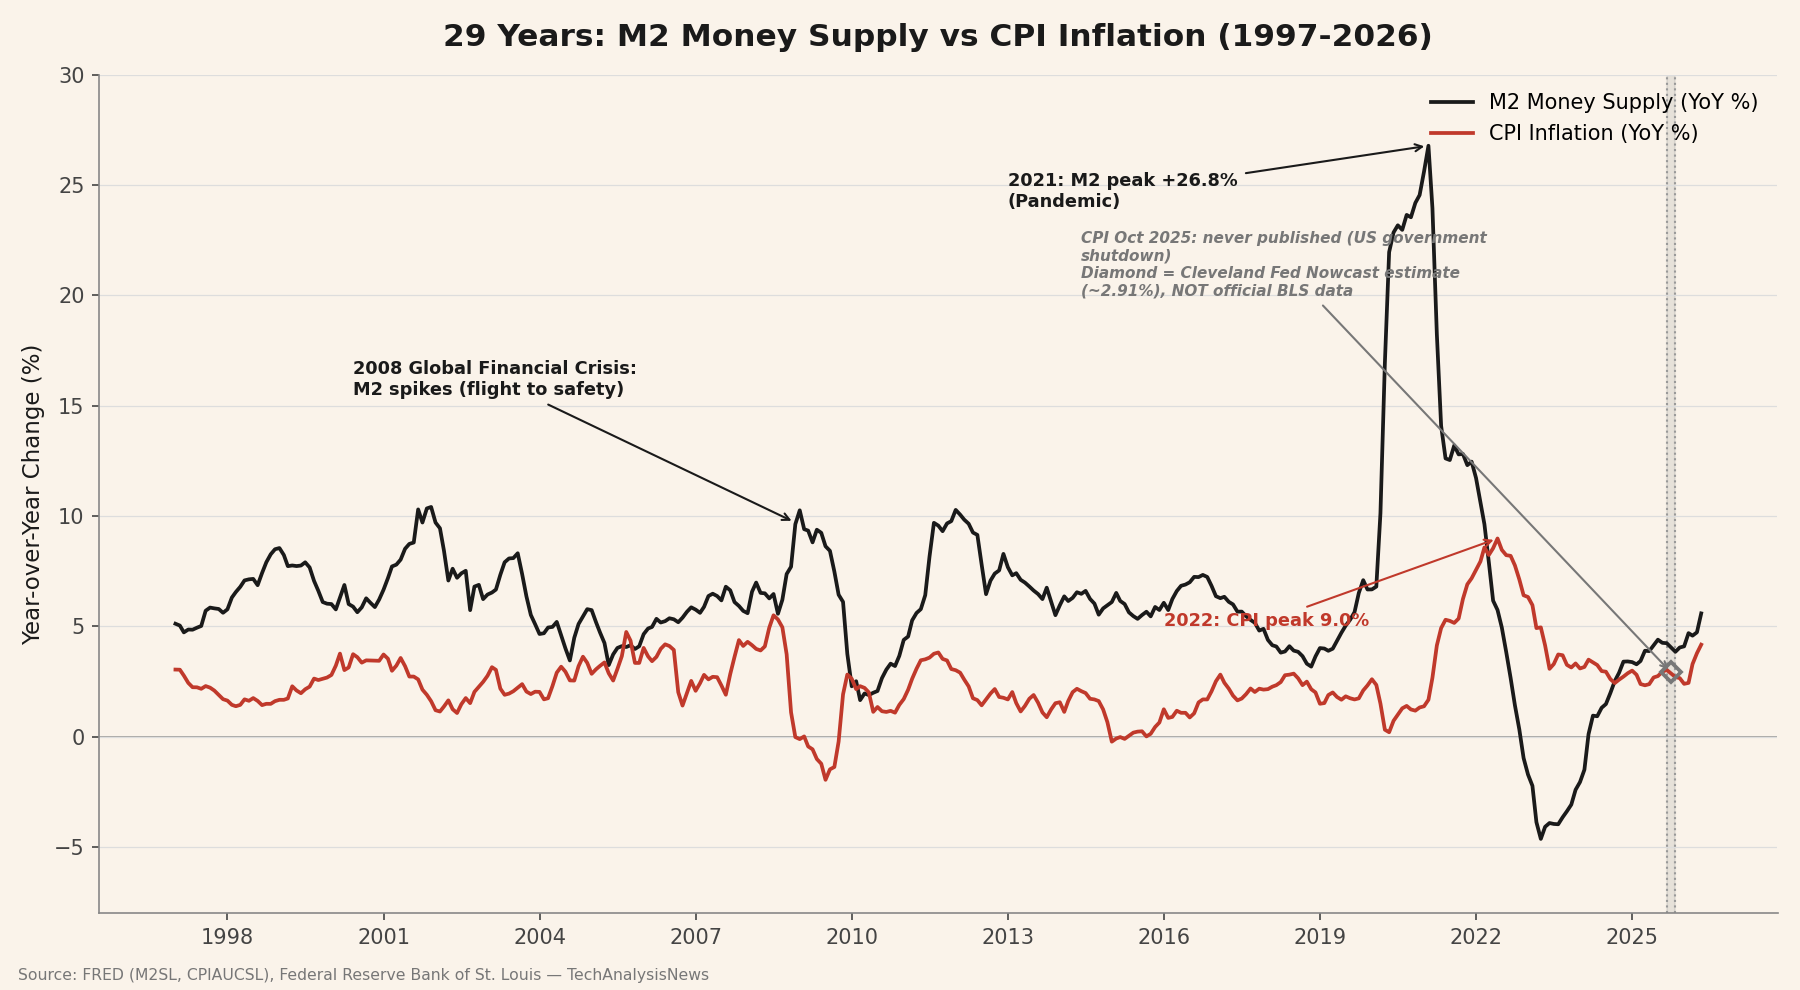
M2 rose by 26.8% year-on-year in February 2021 — a historically extreme rate. The US CPI peaked at 9.1% in June 2022, some 16 months later. This time lag illustrates why the relationship between money supply and inflation should not be interpreted mechanically: velocity of circulation, fiscal policy, supply constraints and the behavior of households and businesses all play a mediating role.
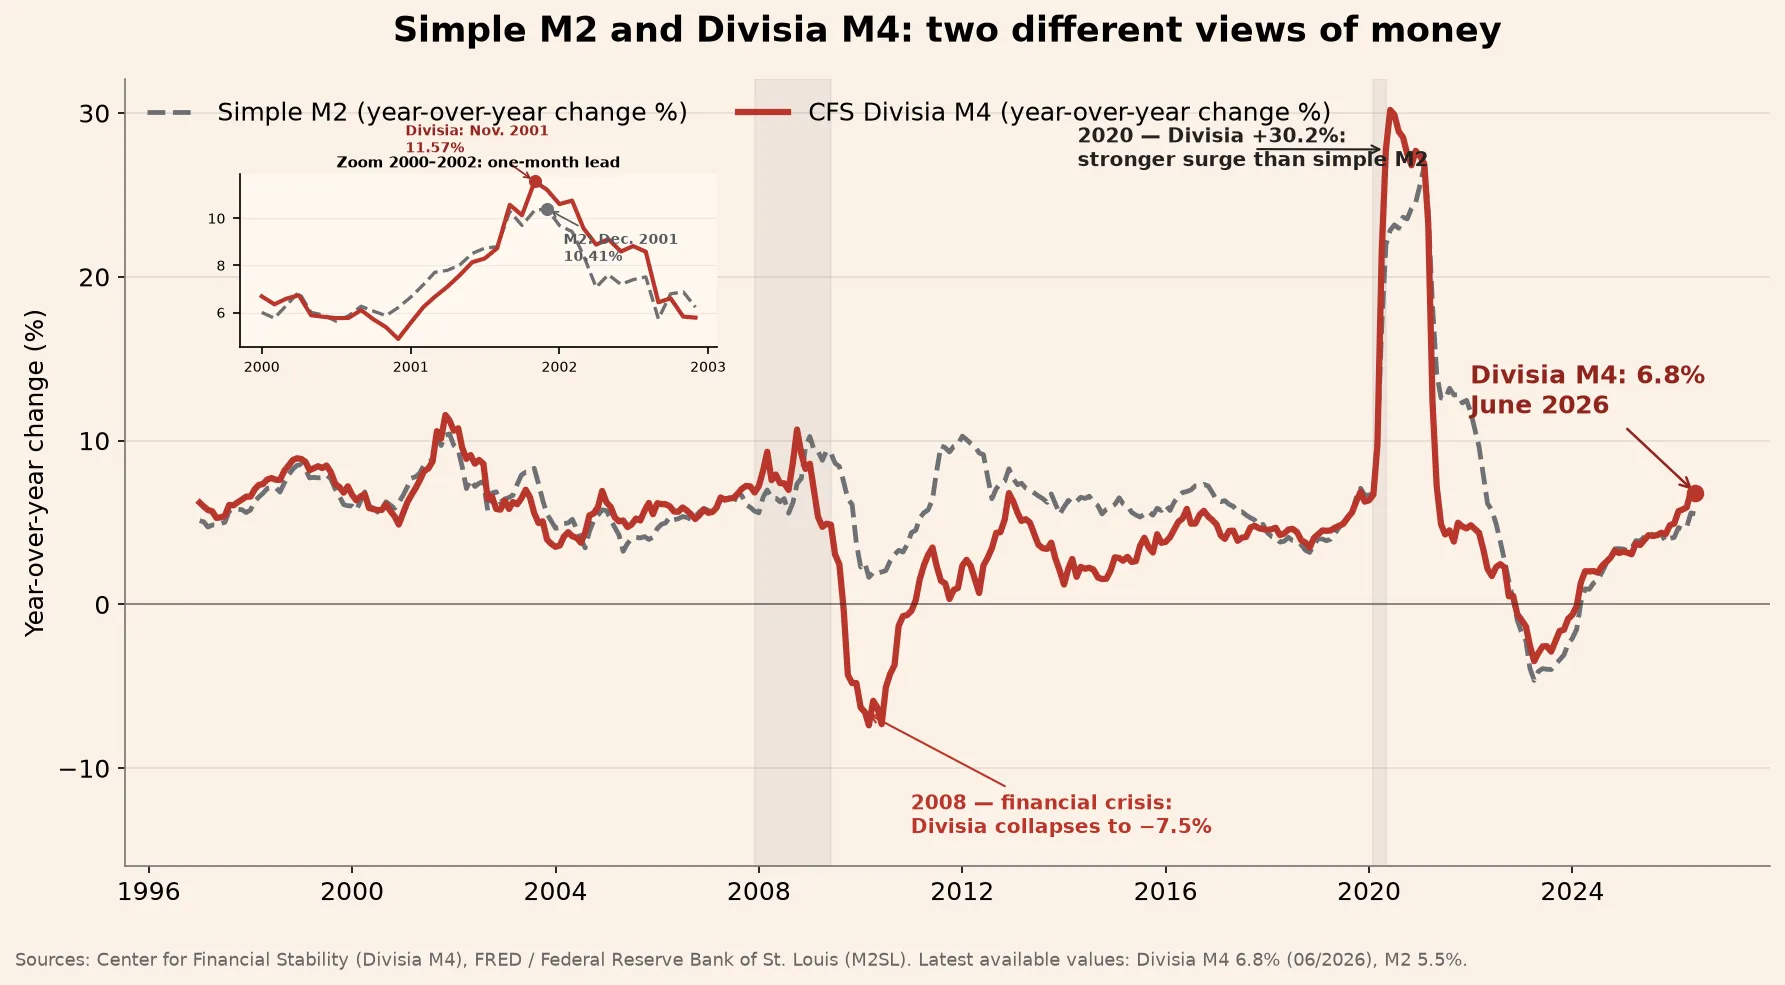
Divisia has at times provided useful warning signals. Following the 2008 financial crisis, the contraction of broader aggregates was consistent with deflationary risks. In 2020, Divisia aggregates accelerated sharply ahead of the 2021–22 inflation surge. These instances are indicative rather than proof of a stable predictive relationship: the reliability of the index must be examined alongside velocity, fiscal stimulus and supply conditions.
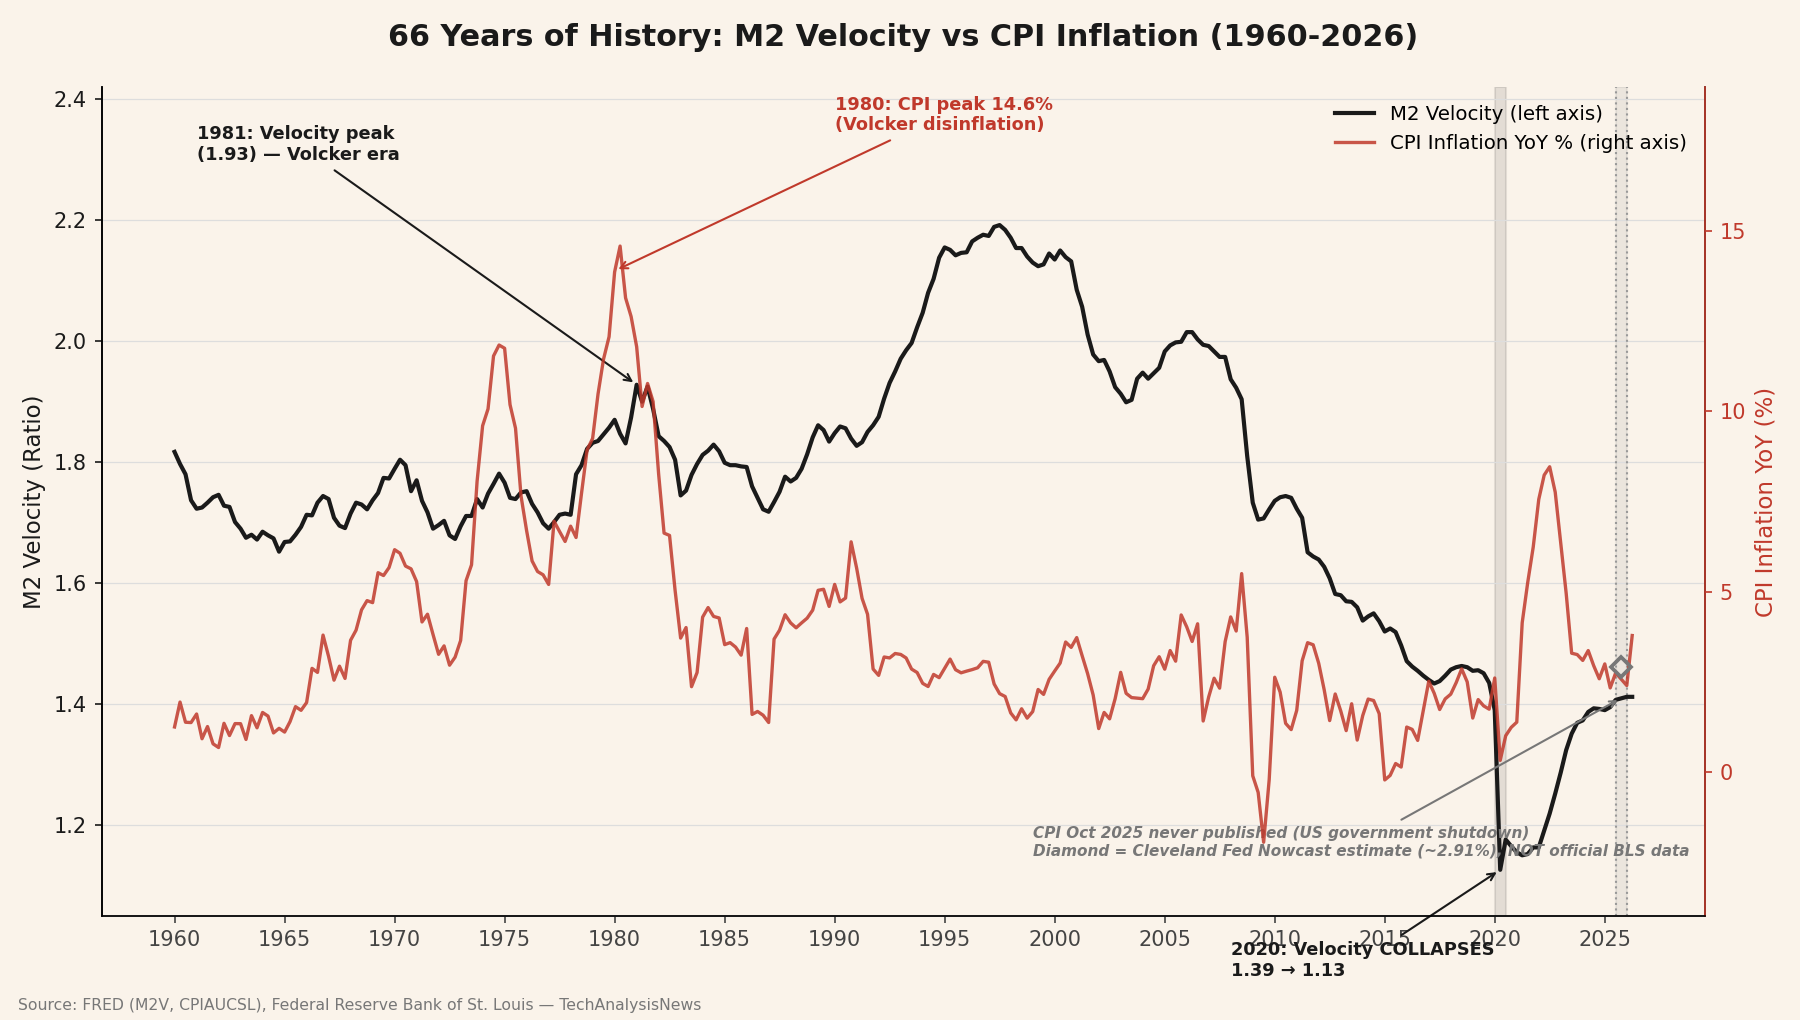
The velocity of circulation shows how often the same stock of money is used for transactions within a year. When M2 surged, the measured velocity dropped sharply because much of the new liquidity remained temporarily in bank accounts. Its subsequent recovery coincided with stronger nominal demand—that is, more spending at current prices. This relationship is useful, but does not prove by itself that one variable caused the other.
The composition of deposits provides further insights, but caution is required. Demand deposits rose sharply in 2020–21, and savings subsequently fell as households drew down some of their accumulated cash reserves. However, changes made by the Federal Reserve to the H.6 statistical publication and to the classification of deposits affect the comparability of the time series. Consequently, the large percentage jumps recorded in demand deposits over that period should not be presented as a net economic change without this caveat.
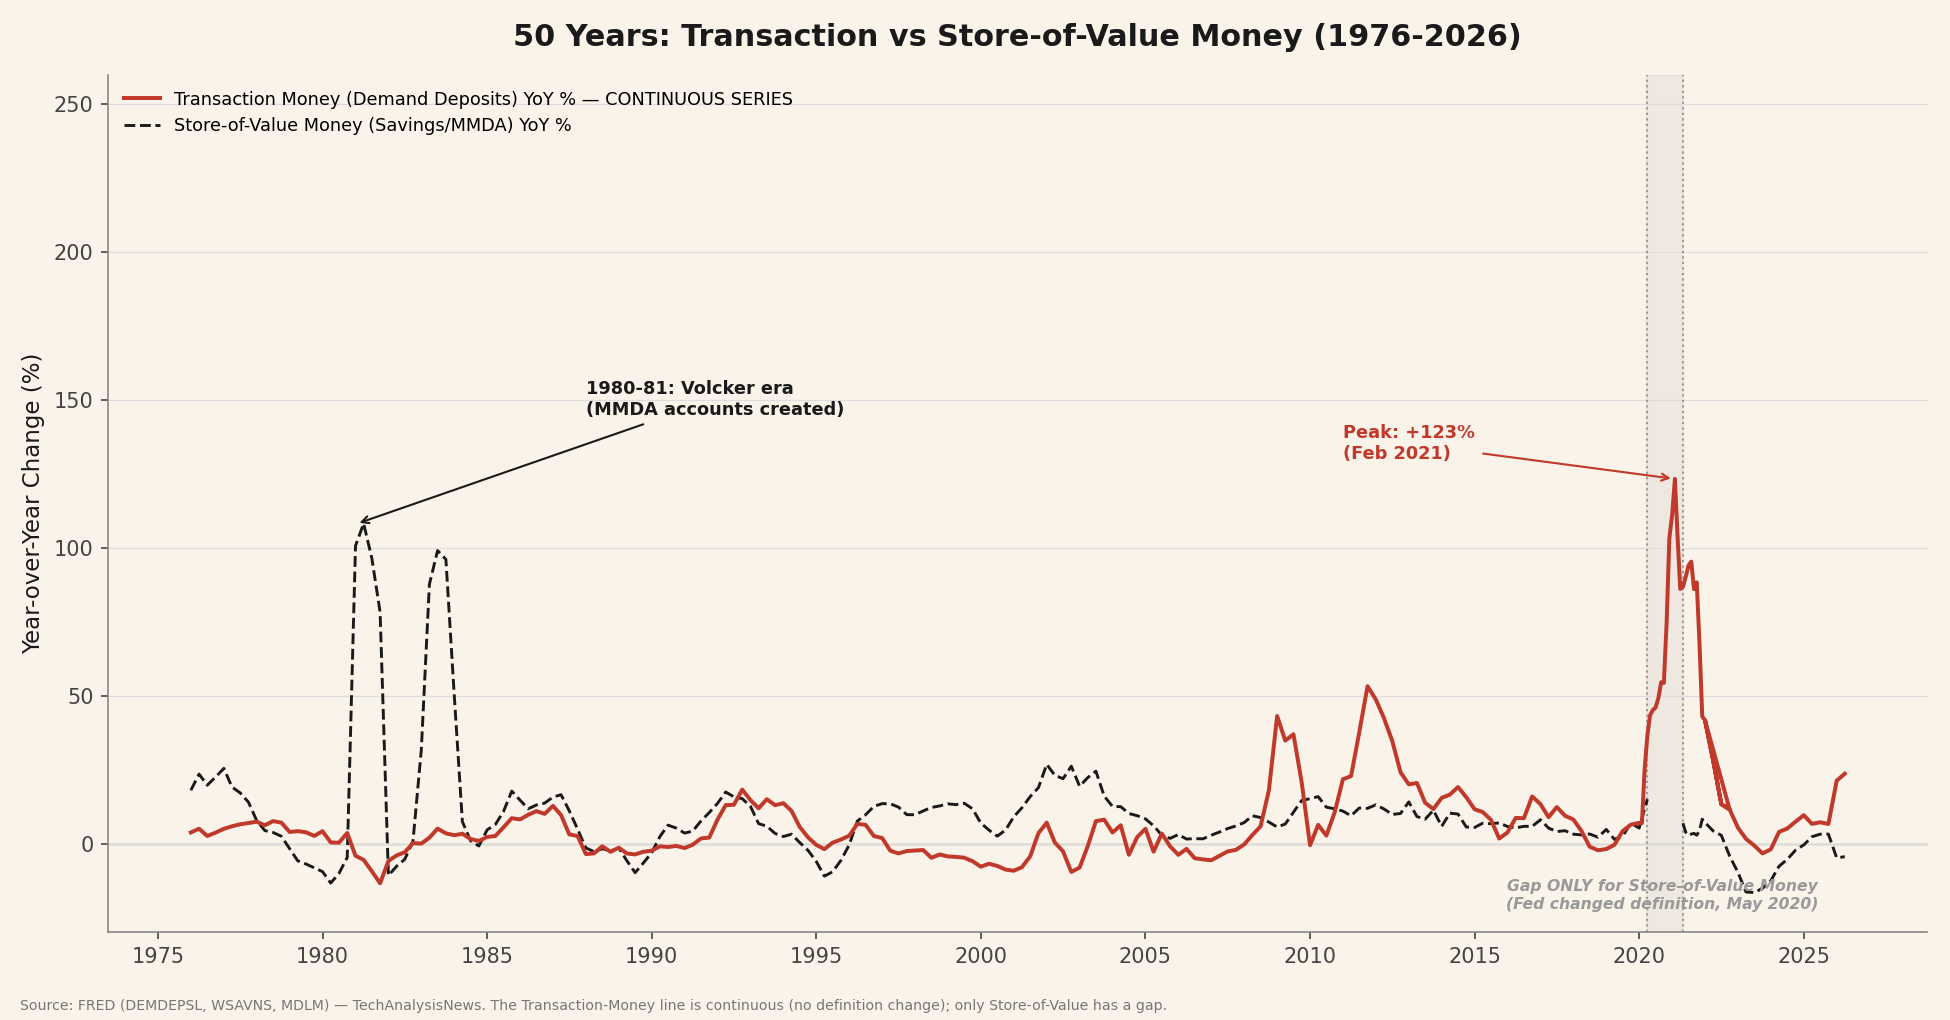
According to the most recent data available, the CFS Divisia M4 accelerated to 6.9% year-on-year in May 2026, up from 5.9% in April. This development is worth noting, but does not in itself constitute a forecast of a new wave of inflation. To be of macroeconomic significance, it must be confirmed by developments in nominal demand, credit expansion, the velocity of circulation and inflation expectations.
The connection to Shinoda's strategy is conditional. If the acceleration of money translates into stronger demand and persistent price pressures, it will reinforce the rate hike scenario that the market has already begun pricing in. In this case, long-term bonds remain vulnerable and the choice of short-duration securities becomes more attractive. However, if velocity and credit demand remain weak, then the discounting of two rate hikes may prove overly aggressive.
Divisia does not offer certainty, nor does it replace the analysis of the real economy. However, it adds a useful signal at a time when markets are pricing in the path of interest rates with little margin for error. For the investor, the critical question is not only when the Fed will move, but which data can distinguish a temporary increase in liquidity from a sustained resurgence of nominal demand. Until clearer confirmation is available, Shinoda’s emphasis on income and shorter duration constitutes a risk management strategy—not a prediction with certainty.
Sources: Bloomberg Television – The Close (Ken Shinoda, DoubleLine) Miran, Roubini & Ireland, A Return to Monetarism? (July 2026)· Federal Reserve Board, H.6 Money Stock Measures and FRED historical series; Center for Financial Stability, CFS Divisia Monetary Aggregates, May 2026 data. The data and correlations do not constitute investment advice.

Certified Technical Analyst (MSTA) and financial/sports writer with expertise in capital markets, trading systems and trading strategies.
Graduate of the Department of Statistics of the London School of Economics and Finance of ALBA Business School.

