


In the previous article, we left a question unanswered. Inflation accelerated again in 2026, reaching 5.4% in April, and we said that to determine whether this constitutes a new wave, we need to examine its composition. ELSTAT publishes the data that allows us to do just that. The answer is that we do not have one form of inflation, but two — and only one of them is on the wane.
Core inflation is the headline index excluding energy and fresh food. The reason for the separation is not that these do not matter to the consumer — they matter more than most. It is that their prices are determined by international markets and the weather, not by the Greek economy.
All that remains is the inflation generated here. And it is this that shows whether the problem is resolving itself or has taken root. The chart places the two indicators side by side, alongside the European Central Bank’s 2% target.
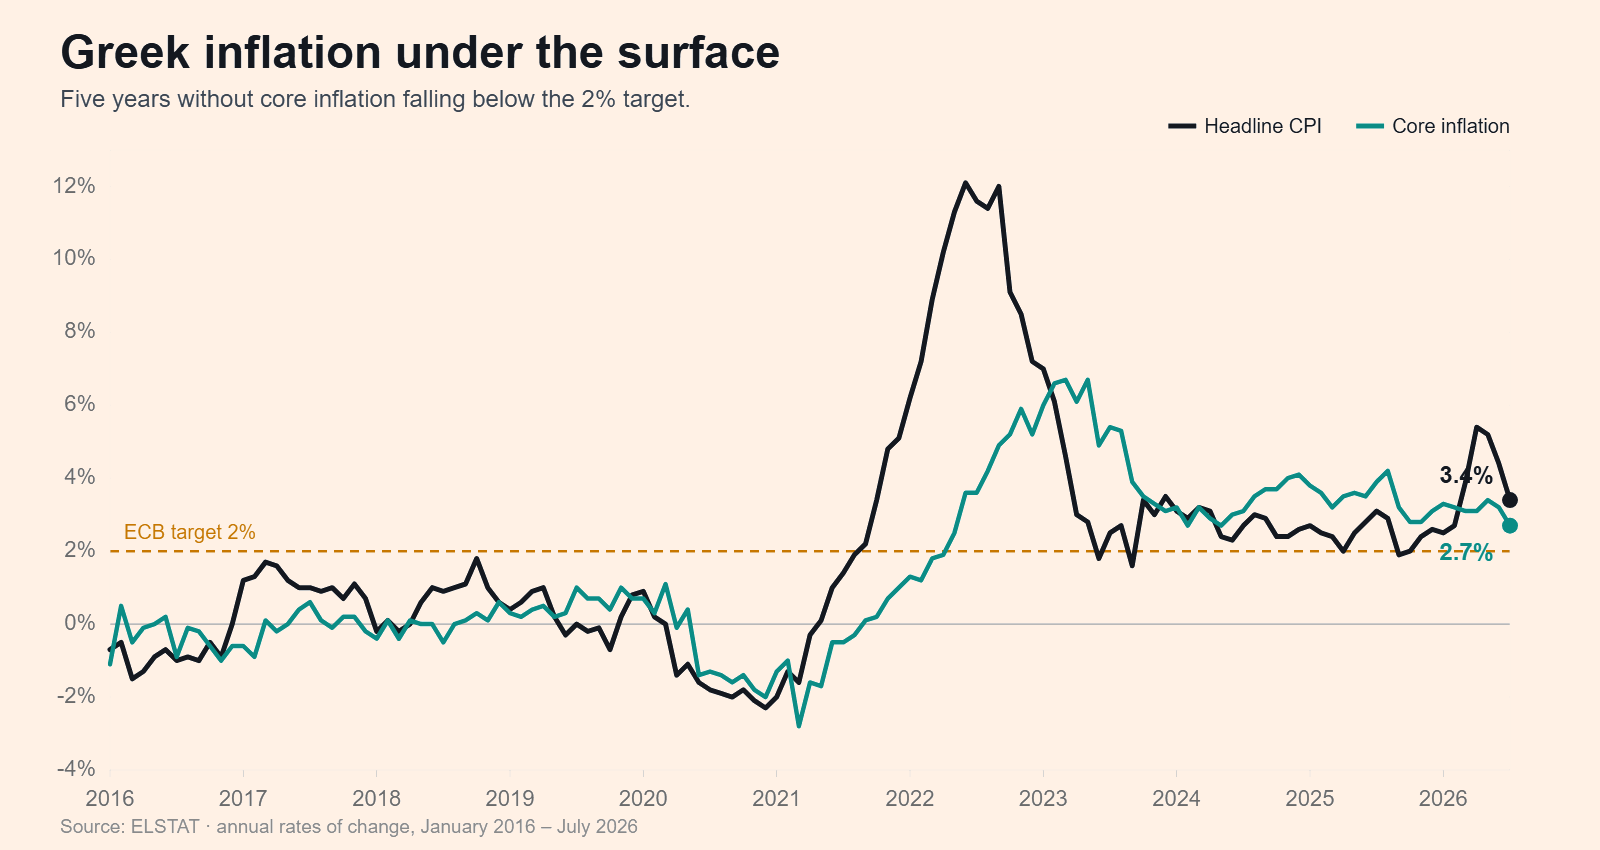
Two things stand out. The structural It is about a year late: it peaked at 6.7% in March 2023, by which time the general index had already fallen by half. And from mid-2021 to the present day, it has not fallen below its 2% target for a single month.
In September 2022, the goods index was running at +15.8%. At the same time, the structural one was in +4.9%. A gap of ten percentage points — the hallmark of a shock driven by energy and food prices, not domestic demand.
The second confirmation comes from a comparison with partner countries. Greece peaked at 12.1% in September 2022, whilst the eurozone peaked at 10.6% in October. Same point in time, similar magnitude. When twenty economies with different structures peak simultaneously, the cause is common and external.
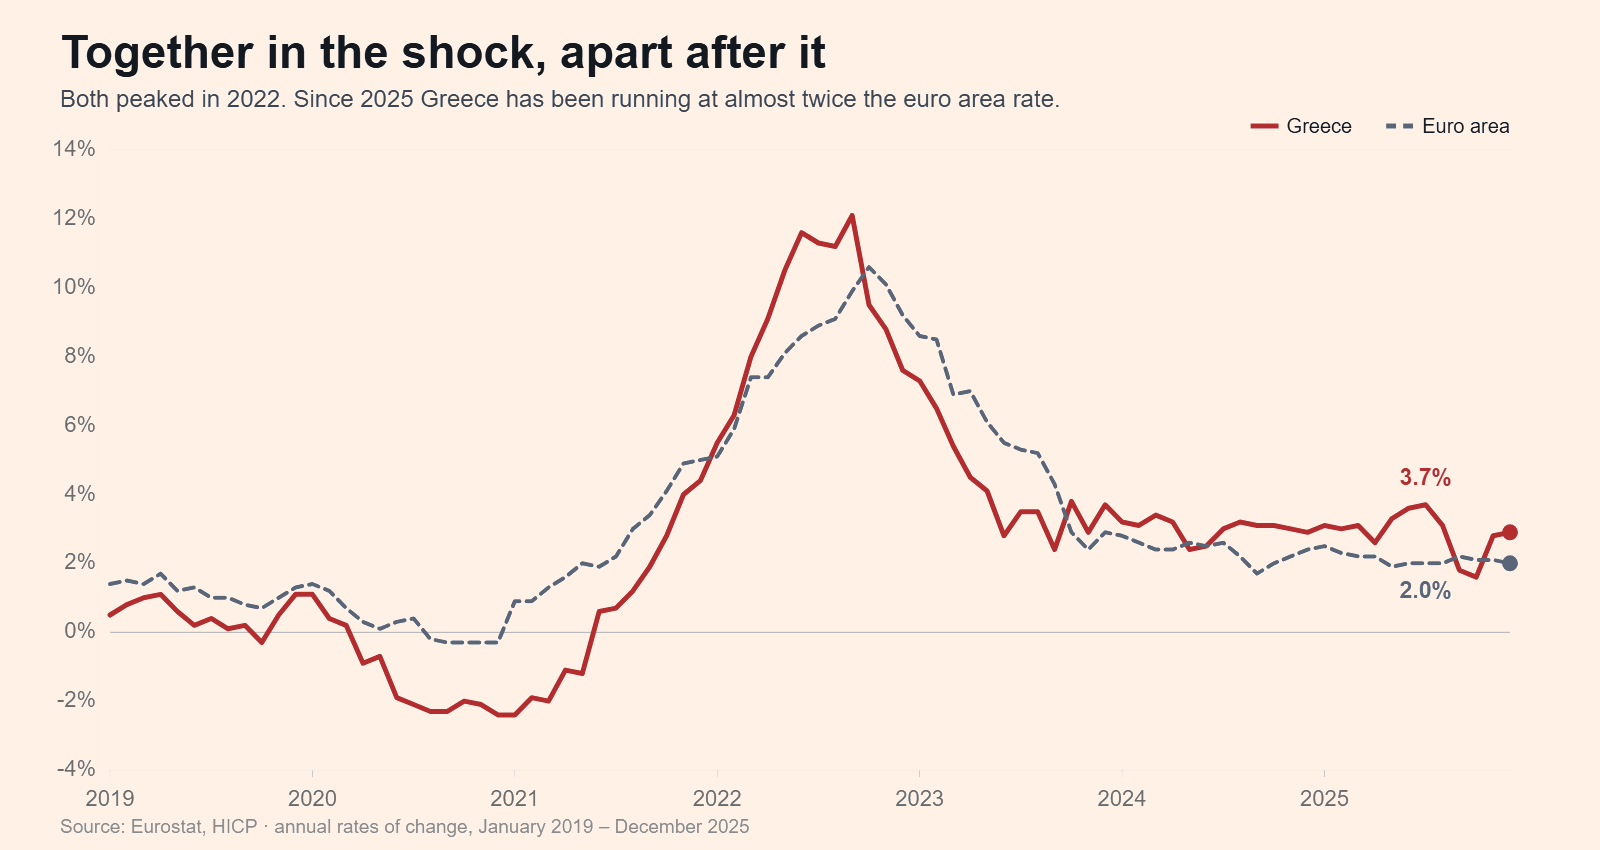
In July 2025 Greece was in 3.7% and the euro area in 2.0%. Almost double the rate, and the gap has persisted for months. International energy prices, however, are the same for everyone. Whatever explains the difference is domestic.
The comparison with the euro area requires an asterisk. In 2022, states subsidised electricity and fuels, some more and some less. Subsidies reduce the price paid by the household, so they appear as a lower measured inflation — without the underlying price pressure having changed.
This means that the peak heights for 2022 are not entirely comparable between countries. synchronisation However, their [trend/path] is not affected: the fact that twenty economies peaked within a month of one another remains an indication of a common, external cause. And the divergence of 2025, which is the real finding, appears after the emergency measures had already been withdrawn.
The clearest sign is found in the comparison of the two categories. In June 2025, goods were running at +0.5% and the services with +5.9%. From 2024 onwards, services have been almost continuously above goods — a reversal of the 2022 picture.
The distinction matters because goods are tradable: they are priced internationally and their price comes from abroad. Services are not. A haircut, a rent, a restaurant meal are priced domestically — by wages, by housing costs or by business margins. Which of the three weighs the most, the services index does not show; other data are needed.
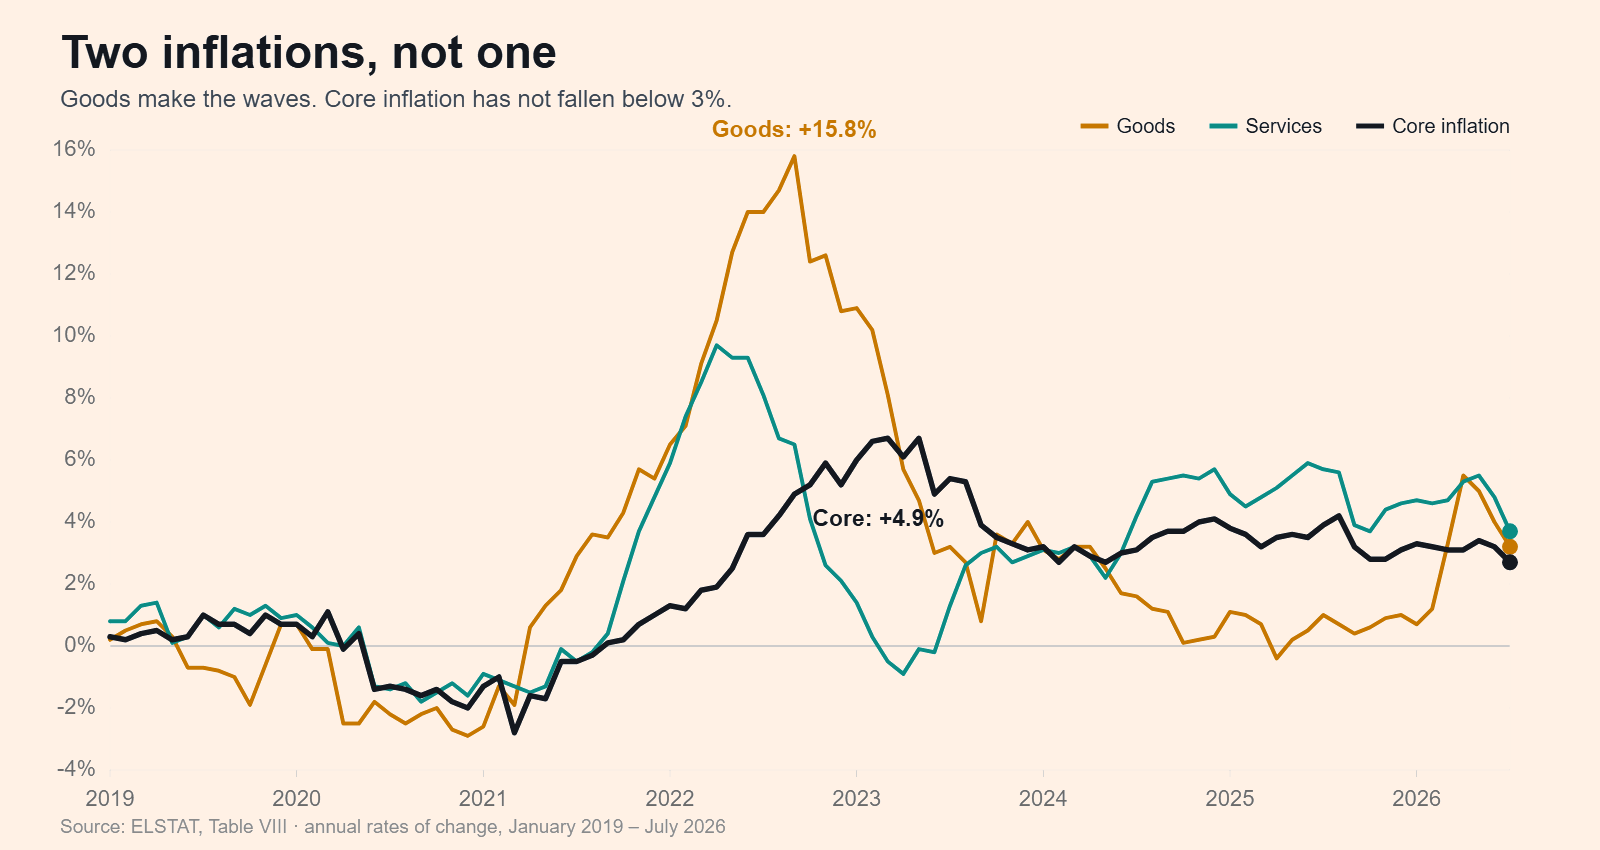
And precision is needed here too, because the easy conclusion would be wrong. The acceleration of 2026 it was also external. The goods index fell from +0.7% in January to +5.51 TP3T in April, whilst the structural parameter did not change at all: it remained at 3.1–3.41 TP3T throughout the entire run.
In other words, the 5.4% we saw in the previous article was yet another surge in energy and food prices on top of a stable domestic base. By July, it had already fallen to 3.2%.
These are two distinct problems of varying duration. The first is the waves: they come from outside, push up the overall index for a few months and then subside of their own accord. The second is the underlying factor — domestic inflation of around 3%, which has not fallen for two years.
The paradox is that public debate is almost exclusively about the first, because that makes the headlines. The second is not seen, precisely because it does not move. And if inflation is now domestic, the next question is not where it comes from but what is fuelling it — wages, rents or profit margins. We will return to this.
Sources: ELSTAT, Indices of Goods, Services and Core Inflation (2020=100.0), January 2009 – July 2026; Eurostat, Harmonised Index of Consumer Prices, January 2019 – December 2025. The data and correlations do not constitute investment advice.

Certified Technical Analyst (MSTA) and financial/sports writer with expertise in capital markets, trading systems and trading strategies.
Graduate of the Department of Statistics of the London School of Economics and Finance of ALBA Business School.


